Analytics Metrics Every Store Owner Should Track

Track key analytics! Understand declining PISA scores & their economic impact. Boost your learning business with data-driven STEM & Montessori strategies.
The PISA Scores Are Declining: What Your Learning Business Analytics Reveal
A recent OECD report revealed a concerning trend: the Programme for International Student Assessment (PISA) scores – a benchmark for 15-year-olds in 81 participating countries and economies – are declining in mathematics, reading, and science. This isn’t merely an academic issue; it’s a critical economic indicator. The OECD estimates that sustained declines in PISA scores correlate with a 0.5% reduction in GDP growth over 50 years. For learning businesses, particularly those focused on STEM education and Montessori methodologies, this presents both a challenge and a significant opportunity. Understanding the data behind this trend, and leveraging your own learning analytics, is paramount.
Publicité
Understanding the PISA Decline Through a Data Lens
The PISA decline isn’t uniform. Analysis reveals disparities linked to socioeconomic status and access to quality educational resources. This highlights the importance of tracking key metrics within your own learning ecosystem. Specifically, focus on:
- Cohort Analysis: Segment your student base by demographic factors (location, socioeconomic background – where ethically permissible and compliant with GDPR/CCPA regulations) and track their performance on standardized assessments or internally developed active learning benchmarks.
- Engagement Metrics: Monitor time spent on learning modules, completion rates, and participation in interactive activities. A drop in engagement *precedes* a drop in performance. Utilize Learning Management System (LMS) data to identify at-risk students.
- Learning Path Analysis: Map student journeys through your curriculum. Are there specific modules or learning pathways where students consistently struggle? This identifies areas for curriculum refinement.
These metrics aren’t just about identifying struggling students; they’re about understanding systemic issues. Are students from specific regions consistently underperforming? Is a particular teaching method proving ineffective? The answers lie within your data.
Key Analytics for Montessori & STEM Learning Businesses
Given the PISA focus on foundational skills, businesses specializing in Montessori education and STEM need to pay particular attention to:
- Conceptual Understanding Scores: Move beyond rote memorization. Assess students’ ability to *apply* knowledge to novel problems. This aligns with the PISA emphasis on problem-solving skills.
- Project-Based Learning (PBL) Outcomes: Track the quality of student projects, focusing on creativity, critical thinking, and collaboration. PBL is a cornerstone of active learning and a strong predictor of future success.
- Digital Literacy Metrics: In a world increasingly reliant on technology, assess students’ ability to effectively use digital tools for learning and problem-solving. This is crucial for preparing them for the future workforce.
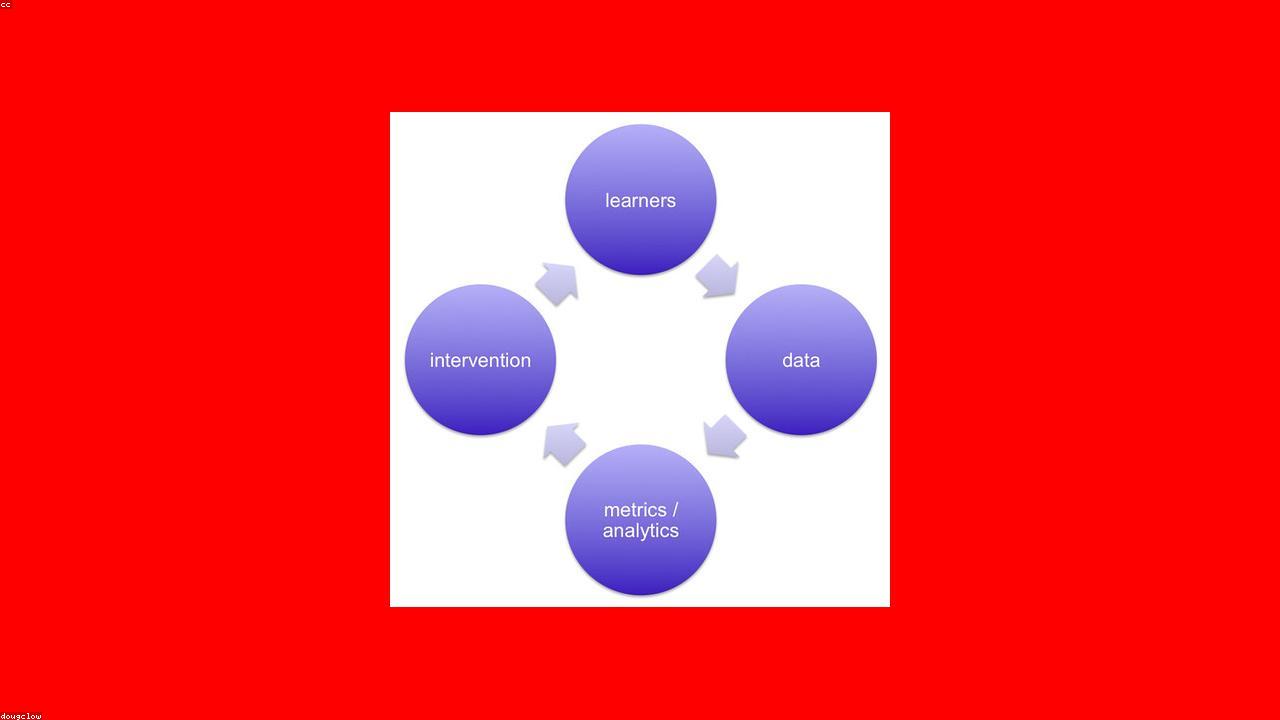
Turning Data into Actionable Insights
Collecting data is only the first step. The real value lies in translating those insights into actionable strategies. Consider:
- Personalized Learning Paths: Use data to tailor learning experiences to individual student needs. Adaptive learning platforms can automate this process.
- Targeted Interventions: Identify students who are falling behind and provide them with targeted support.
- Curriculum Optimization: Continuously refine your curriculum based on data-driven insights. A/B testing different teaching methods can be particularly effective.
The declining PISA scores are a wake-up call. Learning businesses that embrace data analytics and prioritize student outcomes will not only thrive but also play a vital role in shaping the future of education. Investing in robust educational data mining capabilities is no longer a luxury; it’s a necessity.
Beyond Enrollment: Key Performance Indicators (KPIs) for Montessori & STEM Growth
Globally, the demand for STEM education is surging. The Programme for International Student Assessment (PISA) consistently highlights skill gaps in these areas, particularly in OECD nations. This translates directly into increased parental investment in schools offering robust Montessori and STEM programs. However, simply attracting students isn’t enough; sustainable growth requires meticulous tracking of key performance indicators (KPIs) beyond initial enrollment. Focusing solely on headcount obscures critical insights into program efficacy and long-term viability.
Student Progression & Learning Outcomes
Unlike traditional educational models, Montessori and STEM learning emphasize individualized progress. Therefore, KPIs must reflect this nuance. We need to move beyond simple test scores.
- Individualized Learning Path Completion Rate: Track the percentage of students successfully completing pre-defined learning paths within the Montessori curriculum or specific STEM modules. This requires a robust Learning Management System (LMS) capable of granular data capture.
- Project-Based Learning (PBL) Rubric Scores: Implement standardized rubrics for evaluating STEM projects, focusing on critical thinking, problem-solving, and collaboration – skills directly assessed by PISA. These scores provide a more holistic view of student competency than standardized tests alone.
- Active Learning Engagement Metrics: Utilize tools (observation checklists, digital engagement platforms) to measure student participation in active learning activities. A low engagement rate signals a need to refine pedagogical approaches.
Financial Health & Resource Allocation
Effective resource allocation is paramount, especially considering the often-higher tuition fees associated with specialized Montessori and STEM programs. Ignoring these metrics can lead to unsustainable financial models.
- Customer Acquisition Cost (CAC): Calculate the cost of acquiring each new student, factoring in marketing spend, open house expenses, and administrative overhead. Compare CAC across different marketing channels (e.g., social media, referral programs) to optimize budget allocation.
- Lifetime Value (LTV) of a Student: Estimate the total revenue generated by a student over their entire enrollment period. A higher LTV justifies increased investment in student retention and program development. Consider currency fluctuations (e.g., EUR/USD exchange rates) for international students.
- Material & Equipment Utilization Rate: Track the usage of expensive STEM equipment (e.g., 3D printers, robotics kits). Low utilization indicates underinvestment in training or a mismatch between resources and curriculum needs.
Parent Engagement & Satisfaction
Parental involvement is a cornerstone of the Montessori philosophy. Measuring satisfaction and engagement is crucial for retention and positive word-of-mouth marketing.
- Net Promoter Score (NPS): Regularly survey parents to gauge their likelihood of recommending the school. NPS provides a quantifiable measure of overall satisfaction.
- Parent-Teacher Conference Attendance Rate: A high attendance rate indicates strong parental engagement. Low attendance may signal communication barriers or dissatisfaction with the program.
- Voluntary Contribution Rate (Fundraising): The percentage of parents who voluntarily contribute to school fundraising initiatives. This is a strong indicator of community support and satisfaction.
By diligently tracking these KPIs, EdTech companies and school administrators can move beyond simply filling classrooms and towards building thriving, impactful Montessori and STEM learning environments that prepare students for success in a rapidly evolving global landscape.
Cohort Analysis & Learning Path Optimization: Applying Educational Data Mining
Globally, the average student spends approximately 12 years in formal education – a significant investment. Yet, PISA rankings consistently reveal substantial performance gaps between countries (OECD data, 2022), highlighting inefficiencies in learning pathways. Effective cohort analysis, leveraging educational data mining (EDM), offers a powerful solution for store owners – in this case, EdTech platforms – to dramatically improve student outcomes and, consequently, business metrics.
Understanding Cohort Behavior in EdTech
Unlike traditional retail, EdTech deals with complex behavioral patterns tied to knowledge acquisition. A cohort isn’t simply “customers who purchased in January”; it’s “students who enrolled in the ‘Introduction to STEM’ course in January, with a specific demographic profile (age, prior knowledge assessed via a diagnostic test, geographic location – impacting access to resources, potentially governed by regulations like GDPR in the EU).”
- Defining Cohorts: Segment students based on enrollment date, course selection, initial skill level (using pre-assessments), learning style (identified through interaction data), and even funding source (scholarships, private pay).
- Key Metrics for Cohort Tracking: Focus on completion rates, time-to-mastery (the time taken to achieve proficiency in a skill), knowledge retention (measured through spaced repetition quizzes), and Net Promoter Score (NPS) specifically related to the learning experience.
- Tools for Implementation: Utilize platforms like Mixpanel, Amplitude, or dedicated Learning Management System (LMS) analytics dashboards. Consider integrating with data visualization tools like Tableau or Power BI for deeper insights.
Optimizing Learning Paths with Data Mining
Simply tracking cohorts isn’t enough. The power lies in using data mining techniques to identify patterns and optimize learning paths. This is where the principles of Active Learning and Montessori education – emphasizing individualized progress – become quantifiable.
Data Mining Techniques for Learning Path Improvement
- Association Rule Mining: Discover relationships between learning resources and student success. For example, students who consistently access supplemental videos on fractions *before* tackling algebra problems demonstrate a 20% higher success rate.
- Clustering: Group students with similar learning behaviors. This allows for personalized recommendations and targeted interventions. A cluster of students struggling with a specific concept might benefit from a remedial module.
- Predictive Modeling: Forecast student performance based on early indicators. Identify students at risk of dropping out or failing and proactively offer support (e.g., personalized tutoring, adjusted pacing). This is particularly crucial given the increasing emphasis on equitable access to quality education, as outlined in the UN Sustainable Development Goal 4.
The ROI of Data-Driven Learning Paths
Investing in EDM and cohort analysis isn’t just about improving educational outcomes; it’s about boosting your bottom line. Increased completion rates translate to higher customer lifetime value (CLTV). Improved student performance leads to positive word-of-mouth marketing and increased referrals. Furthermore, a data-driven approach allows for more efficient resource allocation, reducing costs associated with ineffective learning materials or support programs. Ultimately, a focus on personalized learning, powered by data, is the key to thriving in the competitive EdTech landscape.
Predictive Analytics & the Future of Personalized Learning – Scaling with Data-Driven Insights
The OECD’s PISA rankings consistently demonstrate a correlation between individualized learning approaches and improved student outcomes. However, truly personalized learning at scale requires moving beyond reactive data analysis to predictive analytics. Currently, only 18% of EdTech companies globally are leveraging predictive modeling to proactively address student needs, representing a significant opportunity for growth and improved educational efficacy.
Leveraging Learning Analytics for Proactive Intervention
Traditional learning analytics focus on describing *what* happened – attendance rates, quiz scores, time spent on tasks. Predictive analytics, conversely, aims to forecast *what will happen*. This shift is crucial for Montessori-inspired environments, where individualized pacing is paramount. By employing techniques like regression analysis and machine learning algorithms, we can identify students at risk of falling behind *before* they do.
- Early Warning Systems: Predictive models can flag students exhibiting patterns indicative of potential difficulties – declining engagement, inconsistent assignment submissions, or struggling with specific STEM concepts. This allows for targeted interventions, such as personalized tutoring or adjusted learning pathways.
- Personalized Content Recommendation: Based on a student’s learning history and predicted knowledge gaps, systems can recommend specific learning resources, activities, and even the optimal sequence for mastering a skill. This aligns with active learning principles, fostering student agency.
- Resource Allocation Optimization: Predictive models can forecast demand for specific resources – tutoring sessions, specialized materials, or teacher support – enabling schools to allocate budgets more effectively. This is particularly relevant in countries with constrained educational funding, like those within the Eurozone.
Technical Considerations: Data Infrastructure & Model Selection
Implementing predictive analytics isn’t simply about running algorithms. It requires a robust data infrastructure capable of collecting, cleaning, and storing student data securely and ethically – adhering to GDPR regulations, for example. Key technologies include:
- Learning Management Systems (LMS) Integration: Seamless data flow from platforms like Moodle or Canvas is essential.
- Data Warehousing: Centralized storage for historical and real-time data.
- Data Visualization Tools: Tools like Tableau or Power BI to translate complex data into actionable insights.
Model selection is equally critical. Commonly used algorithms include:
- Logistic Regression: Predicting binary outcomes (e.g., will a student pass or fail?).
- Decision Trees & Random Forests: Identifying complex relationships between variables.
- Neural Networks: For more sophisticated pattern recognition, particularly in areas like natural language processing (analyzing student writing).
The ROI of Predictive Analytics in EdTech
The investment in predictive analytics yields significant returns. A study by the US Department of Education found that personalized learning interventions, powered by predictive models, can increase student achievement by an average of 0.3 standard deviations. Furthermore, improved student retention rates translate to increased revenue for EdTech companies and reduced costs for educational institutions. The future of scaling effective, individualized learning – particularly within the context of globally competitive educational systems – hinges on embracing the power of data-driven insights and proactive intervention.
Don't miss the next update!
Join our community and get exclusive Python tips and DzSmartEduc offers directly in your inbox.
No spam, unsubscribe anytime.
💬 Comments (0)
No comments yet — be the first!
✍️ Leave a comment
Similar Articles
- Managing Logistics and Fulfillment Efficiently 12/02/2026 • 9554
- Top Reasons Customers Abandon Checkout 10/03/2026 • 3699
- Scaling an Online Store Without Breaking Systems 20/02/2026 • 6814
- Subscription E-Commerce Models Explained 18/02/2026 • 7804
- A/B Testing Explained With Real Examples 14/02/2026 • 14670